0
Skip to Content
Craig Willers
Work
About
Services
Book a strategy call
Open Menu
Close Menu
Craig Willers
Work
About
Services
Book a strategy call
Open Menu
Close Menu
Work
About
Services
Book a strategy call
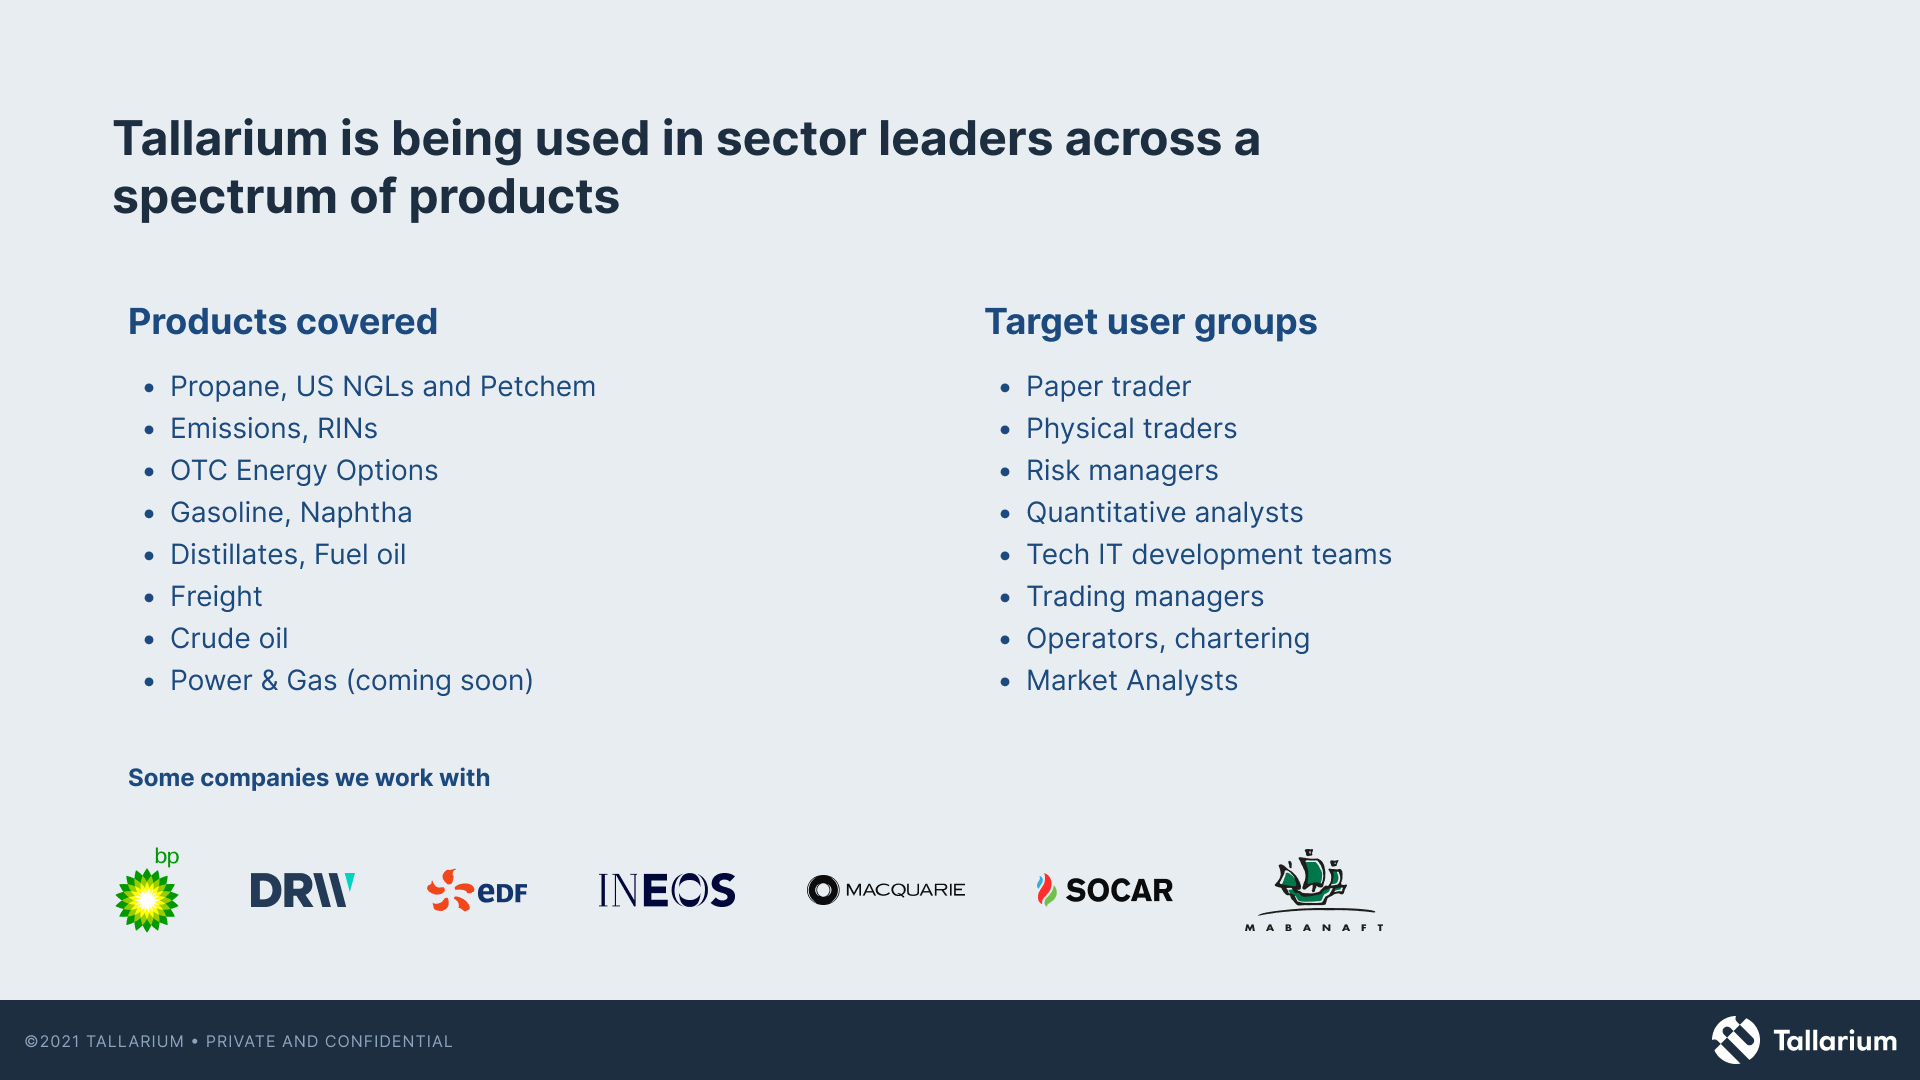
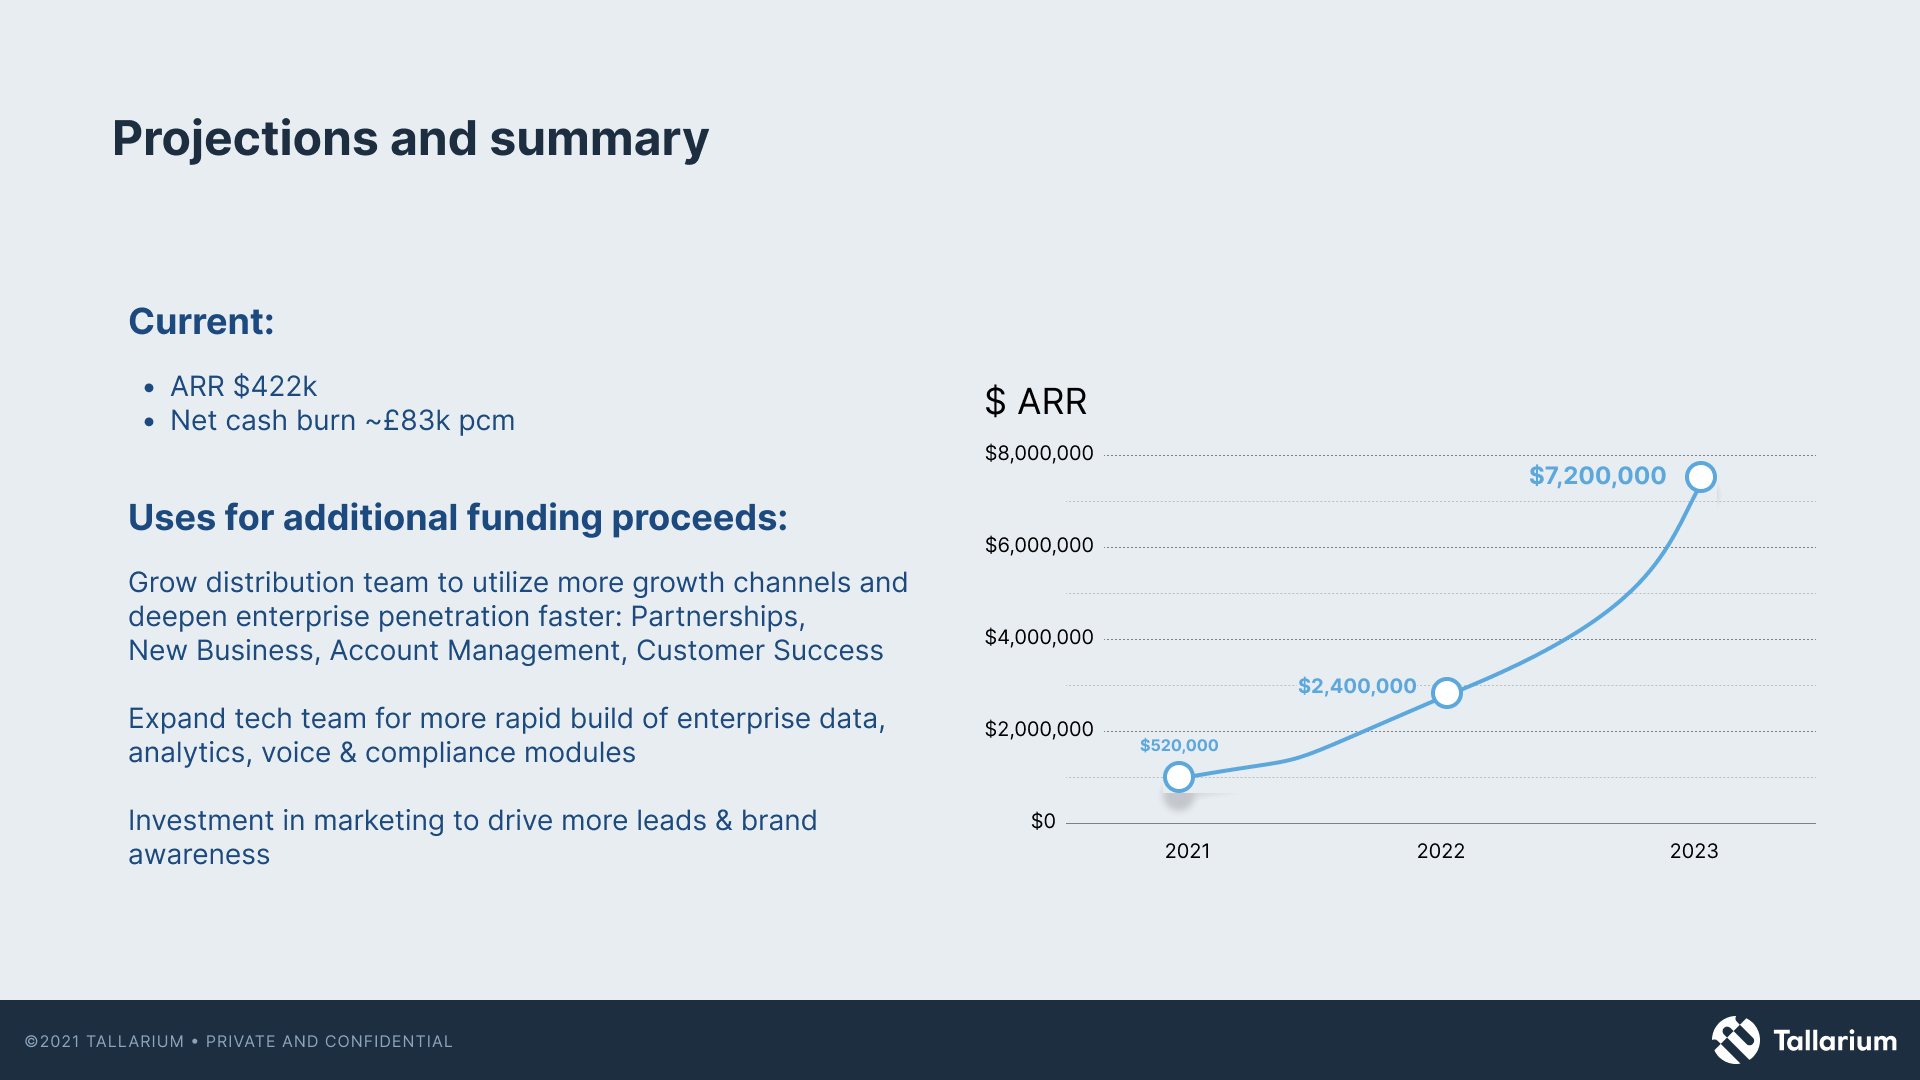
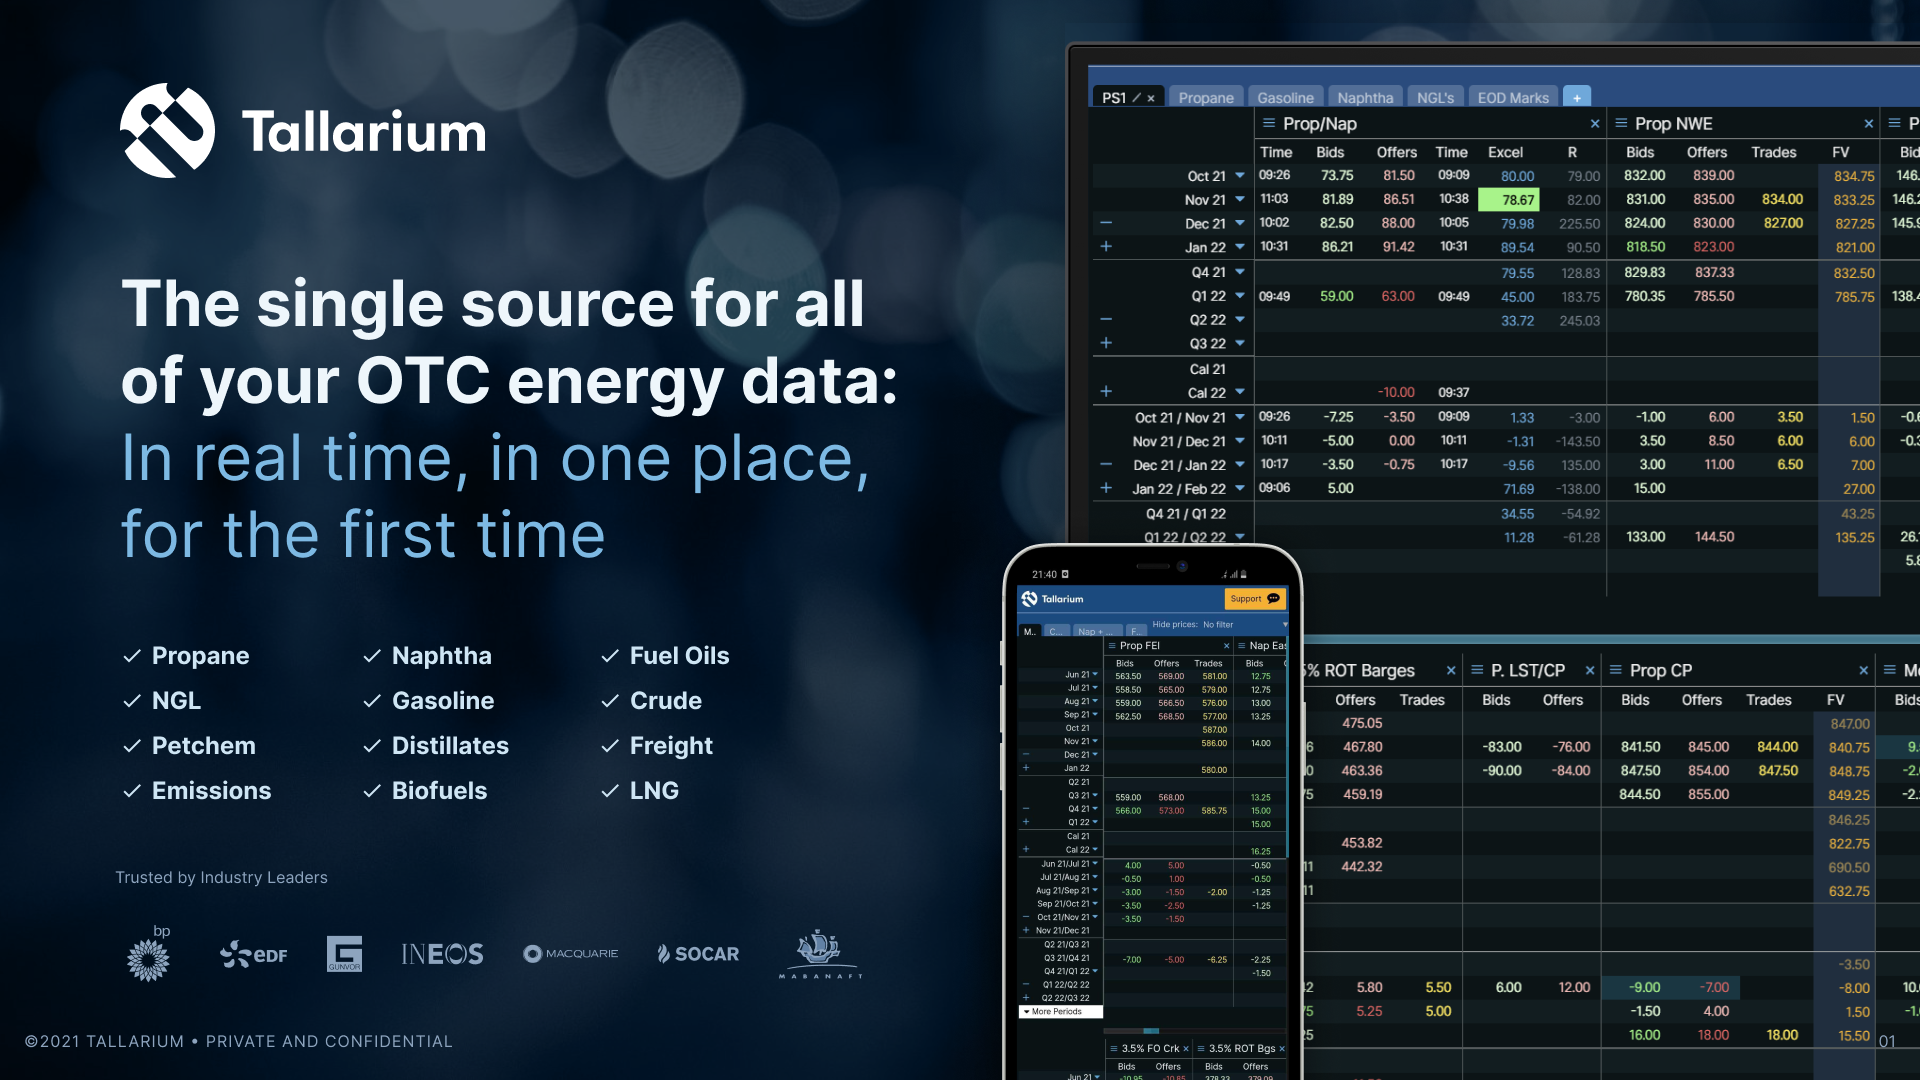
Tallarium
Pitch decks for oil derivatives pricing platform
WhichSchoolAdvisor.com
Leo Trippi